Integrate Grafana Dashboard with Hubot and Slack
Grafana is well-known dashboard which is visualized time series data. Most of the DevOps engineers are currently used Grafana, to configure with various kind of data sources to generate reports.
Here I’m using two AWS instance to demonstrate the Grafana Dashboard with Hubot and Slack. One instance to install the Grafana and Prometheus (Prometheus as a data source ), another one to install Hubot (chat bot).
Design Architecture

Let’s Start Configuring..!
Here I’m not explaining how to launch AWS E2 instance. but still, you are new to AWS please check this link.
Also to please refer below links to install and configure Prometheus with node exporter.
Install Prometheus Link | Install Node Exporter Link.
Yes, I know I have sent you here and there to prepare the initial configurations. I didn't add those configurations to this page because this gets much longer and also my intention is to provide Integrate Grafana Dashboard with Hubot and Slack.
Let's enter into the FUN section..!
Install Grafana.
Here I’m going to install Grafana with yum repository. Its really easy and if you need more installations methods please check this link.
cd /etc/yum.repo.dvim grafana.repo
Add below lines to grafana.repo file
[grafana]
name=grafana
baseurl=https://packages.grafana.com/oss/rpm
repo_gpgcheck=1
enabled=1
gpgcheck=1
gpgkey=https://packages.grafana.com/gpg.key
sslverify=1
sslcacert=/etc/pki/tls/certs/ca-bundle.crt
Trigger Grafana installation
yum install grafana -yStart and enable Grafana service
systemctl start garafana-serversystemctl enable garafana-server
Connect Grafana with Prometheus..!
let’s connect to Grafana dashboard via http://<ip address>:3000
Then we have to add our data source, to do that select the Configuration section

Once you select “Data Source” you can see a page like this
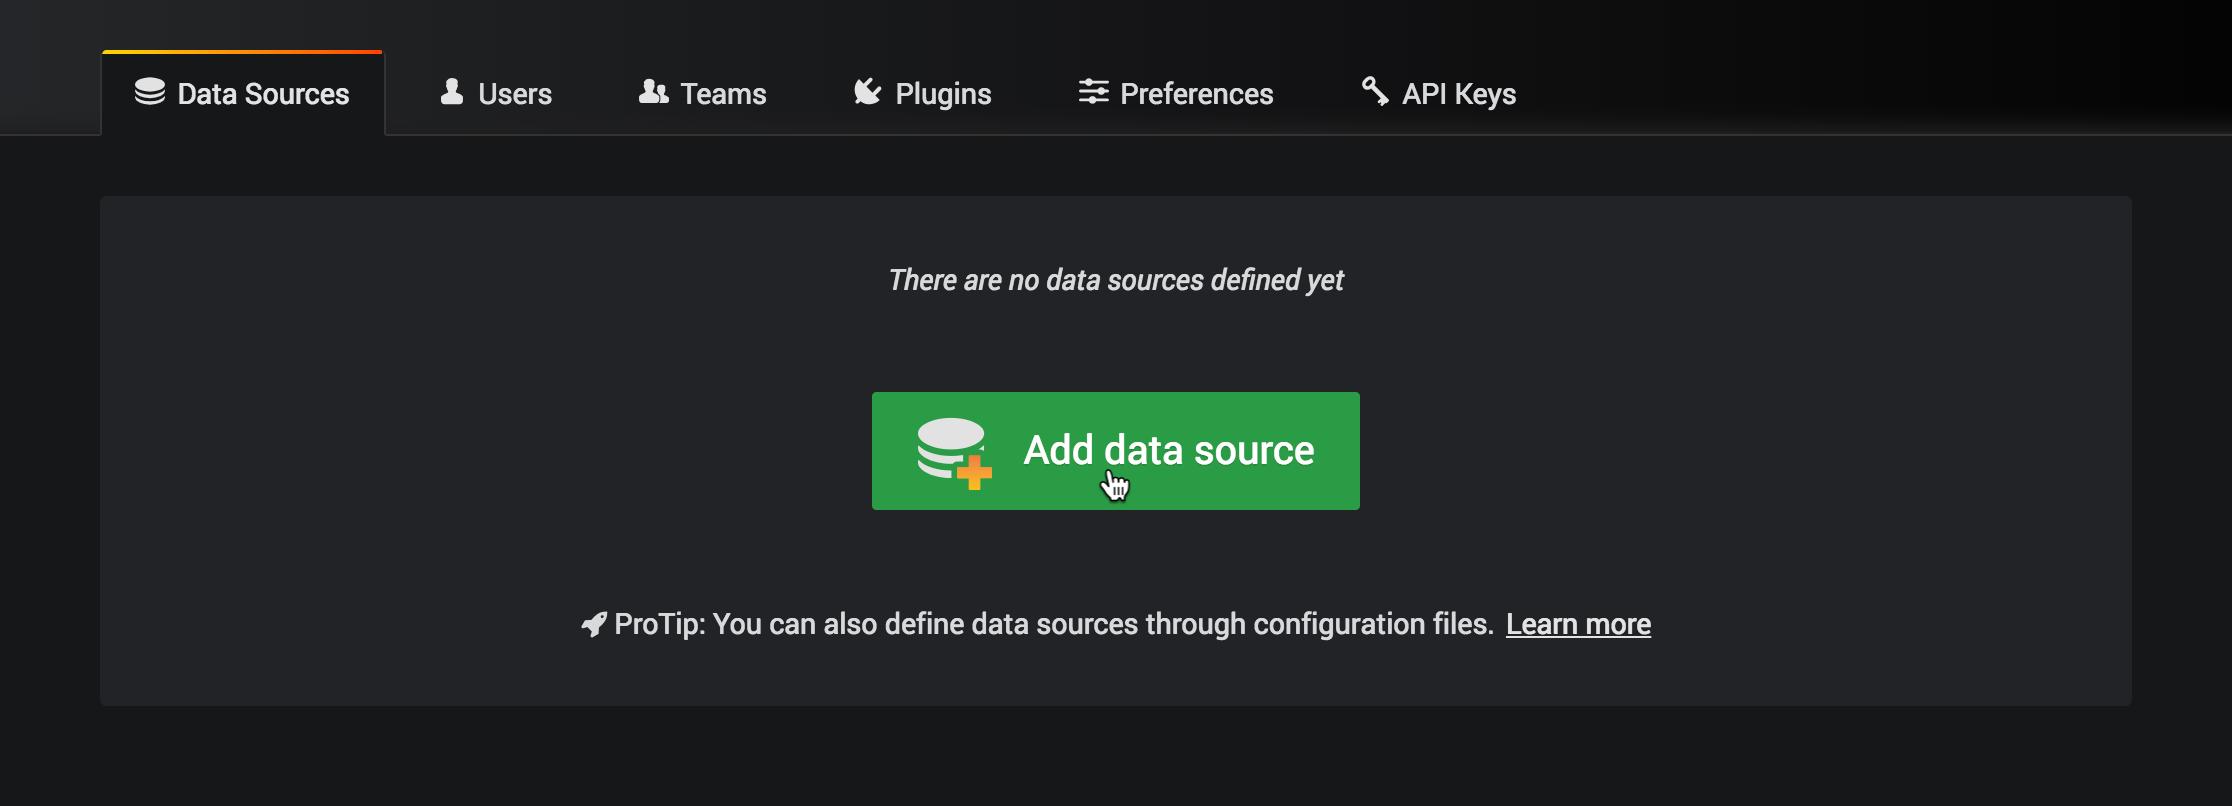
Click on “Add data source” button to continue the configurations. Then select “Prometheus” as a data source.

Configure “data source” parameters. Under name, you can define any name to your data source and under URLput your Prometheus URL (You can find it under configure Prometheus section). Once you finish make sure to save the configurations.

Now we can start to configure dashboards. Select “+” icon and select Dashboard. There you can select “Choose Visualizations ”

Once you click on “Choose Visualizations ” button you can start creating your own graf, But for this demo, I’m going to select “Graph”

Once you select “Graph” it will allow us to add related parameters to develop the graf depending on our requirement.
1ts we need to select “Queries” in here you can have to add “Prometheus” query from Prometheus
Eg:
node_procs_running{instance=”<prometheus-ip>:9100",job=”node_exporter_metrics”}

Likewise, this will allow you to configure Visualization, General & Alert setting according to our choice.
once you configure correctly you can see this type of graphs on your dashboard

Lets Install Hubot..!
login to your 2nd EC2 instance and hit below commands
yum update -y
Install Nodejs and Npm
before install nodejs and npm we have to add the relevent repository to get the packages.
yum install -y https://dl.fedoraproject.org/pub/epel/epel-release-latest-7.noarch.rpmyum install -y epel-releaseyum repolistyum install nodejs npm
Once you have finished the initial installations, we can move forward to configure the Hubot.. for more information please check this link.
npm install -g yo generator-hubotmkdir myhubotcd myhubotyo hubot
Once you hit yo hubot this will run hubot setup and ask some question related to its configurations
Also make sure to grant permission to the required folder, Otherwise this yo hubot installation will give some errors. Anyway if you got some process break error due to permission issue don’t worry you can always runt the yo hubot again . In my installations, I have grant chmod 777 <directory>
Eg:
cd /root/.config/
chmod -Rf 777 insight-nodejs/cd /opt/
chmod -Rf 777 /myhubot/cd /root/
7 /.npm/
Once finished the hubot installation then we have to integrate slack with Hubot.
Integrate Slack with Hubot..!
We have to install hubot-grafana module under Hubot installed directory
npm install hubot-grafana --saveOnce the installation process finished add “hubot-grafan” line in to external-scripts.json file.
[
  "hubot-grafana"
]
Once finished all configurations we have to create a Slack app by integrating hubot api.
Create Slack App..!
Please visit this link https://api.slack.com/apps to create slack workspace and add hubot app.

Once you have click on “Add Configuration” it will open another window to add some required details to finalize the installation.

Note : Make sure to save the Slack api-key
Once Slak app create process is over, then again we have to login to Hubot installed instance and need to add environment variables to before running the Hubot.
Note : generate Grafana API-KEY
Goto Configuration -> api keys and click on “Add API Key” Then enter andm and select Role as Admin and click on “Add” to have the Grafana API Key

vim ~/.bashrcThen add these lines
export HUBOT_SLACK_TOKEN="Slack Token"
export HUBOT_GRAFANA_HOST="http://<Grafana Host IP>:3000"
export HUBOT_GRAFANA_API_KEY="Grafana API Key"
Finally, we can star Hubot. Make sure to move inside the Hubot directory before hitting this command
cd /myhubot./bin/hubot --adapter slack
If there any issue You can troubleshoot with by enabling the debug on hubot
HUBOT_LOG_LEVEL=debug ./bin/hubot --adapter slackNow you can start chatting with Hubot
Hubot commands
hubot graf list
Lists the available dashboardshubot graf db graphite-carbon-metrics
Graph all panels in the dashboardhubot graf db graphite-carbon-metrics:3
Graph only panel with id 3 of a particular dashboardhubot graf db graphite-carbon-metrics:cpu
Graph only the panels containing “cpu” (case insensitive) in the titlehubot graf db graphite-carbon-metrics now-12hr
Get a dashboard with a window of 12 hours ago to nowhubot graf db graphite-carbon-metrics now-24hr now-12hr
Get a dashboard with a window of 24 hours ago to 12 hours agohubot graf db graphite-carbon-metrics:3 now-8d now-1d
Get only the third panel of a particular dashboard with a window of 8 days ago to yesterdayhubot graf db graphite-carbon-metrics host=carbon-a
Get a templated dashboard with the $host parameter set to carbon-a
Enjoy chatting with Hubot..!